In this blog, I am writing about Defender for DevOps and Microsoft DevOps Security. This blog explains the required steps on how to configure Defender for DevOps to make your code more secure with secret scanning.
What is Defender for DevOps?
Microsoft Defender for DevOps is a new addition to Defender for Cloud. At the time of writing it is still in public preview and is currently free to use. Defender for DevOps allows for the protection of code in the popular DevOps environments: GitHub and Azure DevOps.
The benefit of Defender for DevOps is that you have a centralised service where teams can protect their code across multiple DevOps environments. Some key features of Defender for DevOps are:
- A clear overview of how secure DevOps environments are (single pane of glass)
- Having security insights to prevent misconfigurations during the development lifecycle
- Extensive security information for onboarded repositories
Defender for DevOps configuration
Defender for DevOps is an integrated service in Defender for Cloud. To configure Defender for DevOps navigate to the Defender for Cloud resource in Azure as shown in the image below. In the cloud security section, you will find DevOps Security. During preview, configuration and deployment is only possible through the Azure Portal. After the preview, it is possible to configure this service with infrastructure as code.

Azure DevOps connection
The initial step involves integrating a connector, which establishes the link between Defender for DevOps and either GitHub or Azure DevOps. This blog post concentrates primarily on Azure DevOps.
The steps to create a connection are as follows:
- Define connector details
- Defender for DevOps instance name
- Resource group location
- Region
- Select your plan
- During preview, only the
freeplan is selectable.
- During preview, only the
- Authorize the Defender for DevOps connection
- Keep in mind that the Azure subscription and the Azure DevOps organization must be in the same tenant. If this is not the case Defender for Cloud is unable to find your repository.
- After authorizing the Azure DevOps, the selection for Projects and Repositories becomes available as seen in the image below. Here you can select
auto discovery for projects and repositoriesor select repositories you want to connect to Defender for DevOps.

After the connector is created, you will see the Azure DevOps environment added to the overview on the Defender for Cloud page as shown in the image below. It may take a while for the projects and repositories to show up in the overview.

Configure pull request annotations
Once the repositories are loaded, the option to configure automatic pull request annotations becomes available. By enabling pull request annotations, developers gain the ability to see their security issues when they create pull requests targeted to the main branch. Setting up these annotations allows Defender for DevOps to provide feedback on potential vulnerabilities within the pull request.

To configure pull request annotations follow these steps:
- Go to DevOps Security on the Microsoft Defender for Cloud page
- Select the repository on which you want to configure annotations
- Go to configure
- Turn on
Pull Request Annotationsby using the slider- The severity sliders are optional and set to
Highby default
- The severity sliders are optional and set to
After configuring pull request annotations the Pull request status column in the repository table is set to On.
Extension configuration
In addition to setting up the connector, it is also crucial to configure the Microsoft Security DevOps extension on Azure DevOps so that it can interact with Defender for DevOps. In this section I will demonstrate how to make use of this extension within a build validation policy.
Microsoft Security DevOps extension

The configuration to Defender for DevOps is done through the Microsoft Security DevOps (MSDO) extension. This extension integrates with Defender for DevOps. The extension is created by Microsoft and is exclusively available for Azure DevOps Services.
The Microsoft Security DevOps extension replaces the previous Microsoft Security Code Analysis (MSCA) extension. Microsoft Security DevOps is a command-line application that integrates static analysis tools (SAST) into the development lifecycle. The extension is responsible for installing, configuring and running the latest versions of static analysis tools
After the extension has been installed, the build task MicrosoftSecurityDevOps@1 becomes available. This build task installs the following software on the build agent: Microsoft Security DevOps CLI , Microsoft Security Policy and third-party security tooling:

The artifacts published by MSDO are formatted in SARIF, which aligns with another (optional) Microsoft-published extension: the SARIF SAST Scans Tab. This extension enriches Azure DevOps with a visual overview of vulnerabilities.
The extensions can be downloaded here:
- Microsoft Security DevOps: https://marketplace.visualstudio.com/items?itemName=ms-securitydevops.microsoft-security-devops-azdevops
- SARIF SAST Scans Tab: https://marketplace.visualstudio.com/items?itemName=sariftools.scans
Build validation
Scanning for vulnerabilities early in the development lifecycle is very important. For my demonstration, I will implement secret scanning for every pull request targeting the main branch. To accomplish this, I will configure a Build Validation Policy, this is an Azure pipeline which runs during the pull request. The build must succeed before a pull request can merge to the main branch. The build validation uses the MicrosoftSecurityDevOps@1 build task.
The MSDO extension has the following configurable options:

- Config – configuration file for MSDO
- Policy – the name of a Microsoft policy. If no configuration is provided, the policy may instruct MSDO on what tools to run. Default: microsoft
- Categories – A comma-separated list of analyzer categories to run. Values:
secrets,code,artifacts,IaC,containers. Example:IaC,secrets. Defaults to all. - Languages – A comma-separated list of languages to analyze. Example:
javascript,typescript. Defaults to all. - Tools – A comma-separated list of analyzer tools to run. Values:
bandit,binskim,eslint,template-analyzer,terrascan,trivy. - Break – If enabled, this build step will fail if any error-level results are detected. Default: false
- Publish – If enabled, the outputted SARIF results file will be published to the chosen pipeline artifact. Default: true
- Artifact Name – The name of the pipeline artifact to publish the SARIF result file. Default: CodeAnalysisLogs. If left as “CodeAnalysisLogs” it integrates with the SARIF Scans Tab viewing experience.
In my demonstration, I have configured the break setting to true, since I want the build and validation process to fail when secrets are detected. By default, the break setting is set to false. The remaining settings are left at their default values. Below is the YAML file that will be used for the build validation:
| trigger: none | |
| pool: | |
| vmImage: 'windows-latest' | |
| steps: | |
| - task: MicrosoftSecurityDevOps@1 | |
| displayName: 'Microsoft Security DevOps' | |
| inputs: | |
| break: true |
Secret scanning in pull requests
I have created three files: two PowerShell scripts and a Bicep file. Each of these files contain a secret:
This script includes a plaintext personal access token:
| "qnnxhmh5uwwmb6b74ib2h5aqifjjuoq2tgnbgrik3aldcc5ln7na" | az devops login --organization "john-lokerse" |
This script includes a plaintext password:
| az vm create --name 'my-vm' --resource-group 'my-rg' --image Win2022Datacenter --admin-username 'azureuser' --admin-password 'P@ssw0rd1234!' |
This Bicep file includes a plaintext password:
| @description('parUserName is the username for the Virtual Machine.') | |
| param parUserName string = 'admin' | |
| @description('parPassword is the password for the Virtual Machine.') | |
| param parPassword string = 'P@ssw0rd1234!' | |
| resource resWindowsVM 'Microsoft.Compute/virtualMachines@2020-12-01' = { | |
| name: 'my-vm' | |
| location: 'westeurope' | |
| properties: { | |
| hardwareProfile: { | |
| vmSize: 'Standard_A2_v2' | |
| } | |
| osProfile: { | |
| computerName: 'computerName' | |
| adminUsername: parUserName | |
| adminPassword: parPassword | |
| } | |
| ... truncated for length purposes ... | |
| } |
These files are ready to be merged into the main branch through a pull request. However, due to the presence of the build validation, the merge can only proceed if the evaluation result is successful. The build validation runs every time a change has been made. In the image below you can see the pull request that has the build validation configured.

The build validation performs a checkout of the pull request branch. You do not have to configure a checkout in your YAML file since Azure DevOps handles it internally using the "self" checkout. This approach allows the build validation to scan both the existing files and the files that have been modified as part of the pull request.

The image above shows that the output of the pipeline indicates that the build validation has detected secrets. It categorises these secrets, such as recognising an Azure DevOps Personal Access Token or a “general password”.
Automatic pull request annotations
In the previous section of the blog, I have configured pull requests annotations for repository defender-for-devops in Defender for DevOps. This configuration enabled Defender for DevOps to generate a comment on the detected secret as shown in this image below.

SARIF SAST Scans Tab
If the SARIF SAST Scans Tab extension is installed, then the Scans tab on the build is available. On the tab, you can click on the file name to see what secret has been found.

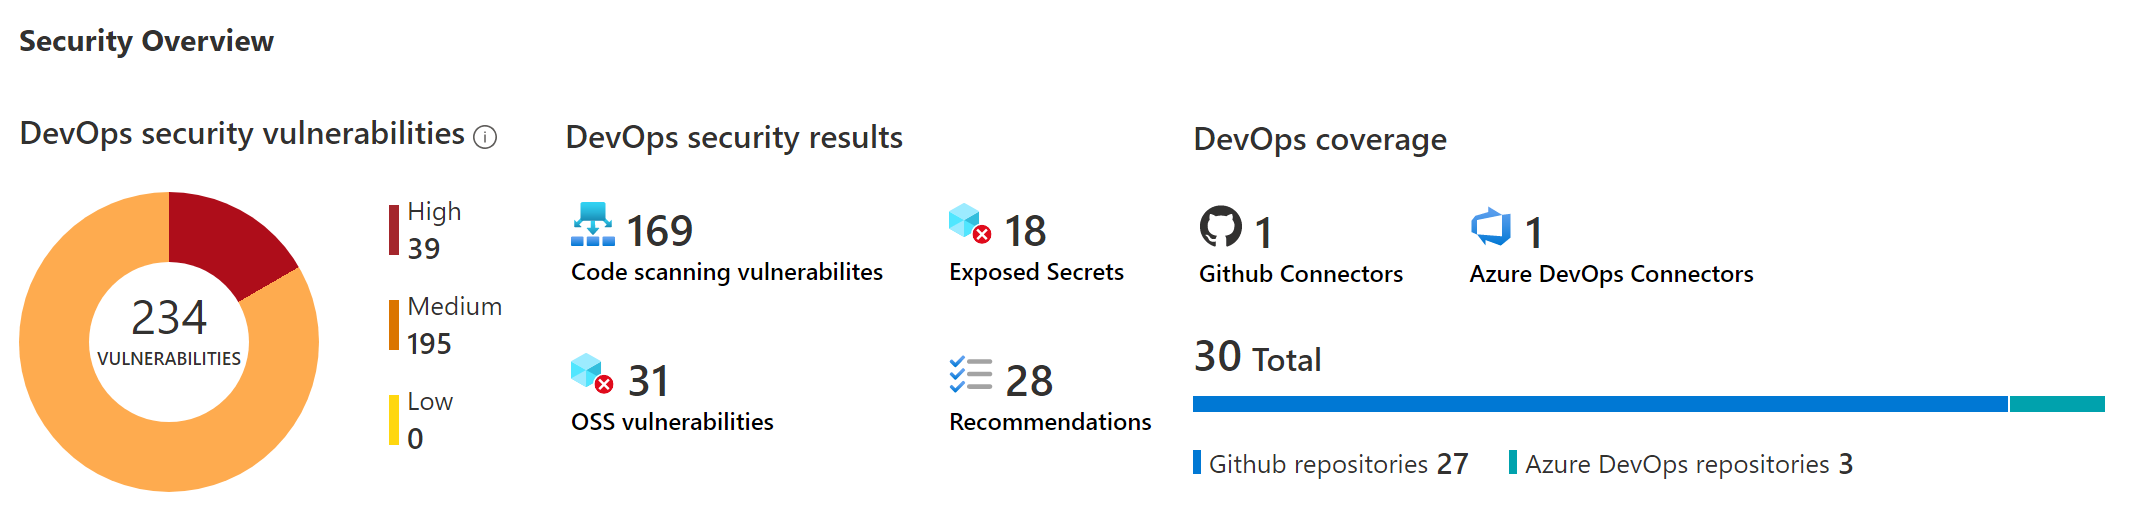
Vulnerabilities found in Defender for DevOps overview
The single pane of glass overview gives insights about the Azure DevOps or GitHub organization. This overview identifies repositories containing detected secrets that require action. While writing this blog post, I found out that detected vulnerabilities are only shown when scanned in the default branch, and not from other branches. This might change during the preview.
For my demonstration, I created another repository and added two files that contain secrets. When secrets are detected they are shown in the overview as shown in the image below.

From the overview, you can click on the repository name. This brings you to the Resource health overview. In the image below you see both healthy and unhealthy security alerts.

By clicking on the security alert description you get more information about the alert. For example, each finding contains information about the branch in which the secret was found and in what script the secret was found. Also, Defender for DevOps gives you the link to the build and repository.

Conclusion
This is how you can configure Defender for DevOps for your Azure DevOps organization. Although the Defender for DevOps is currently in public preview and still under development, it already holds potential to enhance the development lifecycle. Leveraging this service can significantly improve the security of your codebase.
